The Results
Litigation Risk Analysis™ Software Models produce the kind of information that clients need in order to make the most informed decisions about their cases. The analytical results answer three basic questions — in clear, quantified terms.
1. How
much should I pay to settle?
This is answered by solving the decision tree for its Expected
Value.

The Expected Value of Baby Sam v. True
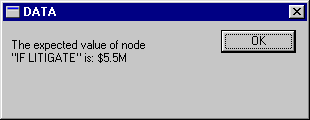
North Hospital is approximately $5.5 million. The
Expected Value is the probability-weighted average of all the possible outcomes captured
in your decision tree. You can think of it as the average award if the case were
tried one hundred times. This is generally the maximum that should be paid in
settlement. (If you would like to see the full, solved decision tree on which this
calculation is based, click here.)
2. Is there any reason
to pay more than the Expected Value?
In large part, this is answered by generating a Probability
Distribution Bar Chart.

A Probability Distribution Bar Chart shows all the possible outcomes captured in your tree (grouped together where similar) and the likelihood of each occurring. It clearly reveals the chance of exceptionally large verdicts being owed (the bars lurking at the far right). If the defendant can’t afford to run such a risk (given its net worth), it may choose to pay a premium above the Expected Value to get the case settled out-of-court.
(In addition, defendants also may want to increase their settlement offers to avoid ongoing legal fees and expert costs, client distractions, bad publicity, setting a bad precedent, etc.)
3. How might the value
of the case change with more information?
This is answered by generating Sensitivity Analysis graphs for the
uncertainties in question.

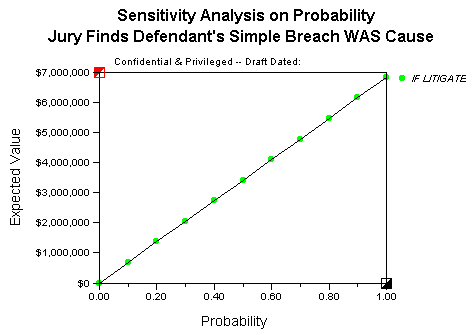
A Sensitivity Analysis tells you how "sensitive" the case value is to changes in the likelihood of prevailing on any given uncertainty. The example above shows how much the Expected Value of Baby Sam v. True North Hospital changes with the likelihood that the trier finds the defendant's breach was the cause of plaintiff's condition.
Two types of conclusions can be drawn from these graphs. First, the graph can help you make early settlement decisions when information is incomplete. Assume Baby Sam's family is willing to settle for $2.5 million (perhaps they can’t run the sizable risk of a defense verdict). Even if you haven’t completely finished exploring your causation defenses, if you felt confident there would be at least a 37% probability of a jury finding True North's breach to be the cause of Baby Sam's condition, the Expected Value would be at least $2.5 million. Therefore, you could settle without "wasting" money on completely finishing your investigation or pretrial discovery.
Second, the graph can help you decide where to spend pretrial money when a reasonable settlement is not possible. As you can see, the Expected Value changes by about $700,000 for every 10 percentage point change in the probability of "breach was the cause." Therefore, if spending $50,000 (to do a better job of showing the connection between the mother's drug addiction and the baby's condition, for example) would decrease the chance of True North’s breach being held the cause by even just 5 or 10 percentage points, that would be a very worthwhile expenditure of your client’s funds.
So how did our Model's results match up to your "gut feel"?
Which would you rather be armed with when a client asks for your recommendation on what to do with such a case? If you see the benefits of our approach, please contact us using the phone number or email shown below.
Litigation Risk
Analysis, Inc.
P. O. Box 1085
Kenwood, CA 95452
phone: (707) 833-1093 fax: (707) 833-0084
e-mail: Info@LitigationRisk.com
©2010.
Litigation Risk Analysis, Inc.
Litigation Risk Analysis is a trademark of Litigation Risk Analysis, Inc.